I've had a GitHub profile stats card for a while now, but I was never fully happy with it. The existing tools each had trade-offs that bugged me, so I ended up building my own by combining the best parts of three different projects. Here's how it went.
## The Problem
There are a few popular projects for adding stats to your GitHub profile README:
### [anuraghazra/github-readme-stats](http://github.com/anuraghazra/github-readme-stats)
This is the OG. You deploy it on Vercel, it uses GitHub's GraphQL API to generate SVG cards on the fly. It's fast, well-maintained, and has tons of themes.
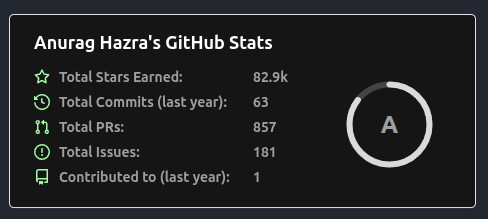
The catch: it can't see your private repos. The GraphQL API with a personal access token will return language data for public repos only, so if you do most of your work in private repos (like I do at Bump), your language breakdown is incomplete. It also caps at 100 repos unless you set a special env var, and even then it's only repos you own — not org repos you contribute to.
### [jstrieb/github-stats](http://github.com/jstrieb/github-stats)
This one takes a different approach. It runs as a GitHub Action, uses the REST API to crawl every repo, and generates static SVGs that get committed back to your repo. Because it runs with your token in Actions, it can access private repos.
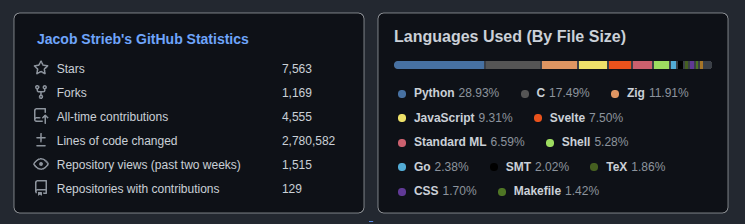
The problem: it hammers the REST API with sequential per-repo requests. GitHub frequently returns 202 "computing" responses, forcing retries and waits. Run times are unpredictable: anywhere from 17 minutes to over an hour depending on GitHub's API mood. It also generates a fixed layout. You can't easily customize it or combine it with other cards.
### [DenverCoder1/github-readme-streak-stats](http://github.com/DenverCoder1/github-readme-streak-stats)
This one does one thing well: contribution streaks. It shows your current streak, longest streak, and total contributions with a nice ring animation.
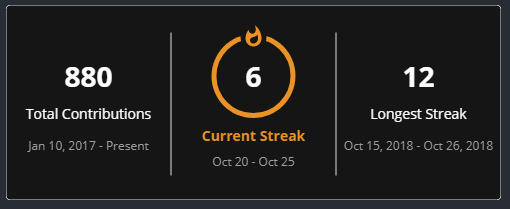
But it runs on an external Heroku instance, which means you're dependent on someone else's server staying up.
## What I Wanted
One card that shows everything:
- Stars, forks, and all-time contributions
- Lines of code changed and repository views
- Current and longest contribution streaks
- Top languages (including private repos)
- Doesn't rely on slow sequential REST calls for everything
- Doesn't depend on external services
- Looks good
## The Hybrid Approach
I forked [anuraghazra/github-readme-stats](http://github.com/anuraghazra/github-readme-stats) and built a hybrid:
**Live (via Vercel, on every request):**
- Contribution streaks — calculated from GitHub's GraphQL contribution calendar. Just two API calls, returns in under a second.
- Top languages — GraphQL with pagination, includes org repos.
**Cached (via a daily GitHub Action):**
- Lines of code changed — REST API, per-repo, with retry logic for 202s.
- Repository views — REST API, requires push access.
- Stars, forks, all-time contributions, repo count — GraphQL with full pagination of owned + contributed-to repos.
The Action runs daily, computes everything, and writes the results to a public GitHub Gist as JSON. When someone loads the card, Vercel reads the cached stats from the gist (instant) and combines them with the live streak and language data.
The key architectural difference from jstrieb: REST is only used where GraphQL can't help (lines changed, traffic views). Everything else uses GraphQL, minimizing API calls and avoiding the rate limiting that makes the pure-REST approach unpredictable. The Action also logs progress per-repo, so when something is slow or failing you can see exactly which repo is the problem.
## The Result
Here's what the combined card looks like:
<img src="https://github-readme-stats-navy-three-39.vercel.app/api/combined?username=compscidr&theme=dark&langs_count=10" />
Everything in one image: stats on the left, languages on the right, streaks at the bottom with ring animations for both current (fire icon) and longest (trophy icon). The language progress bar spans the full width under the title.
It also supports all the themes from the original project:
```
/api/combined?username=YOUR_USERNAME&theme=dark
```
## Streak Calculation
One fun piece was calculating contribution streaks from scratch. GitHub's GraphQL API exposes `contributionCalendar` data per year, which gives you every day's contribution count. To get streaks across all years, the code:
1. Queries `contributionYears` to find every year you've been active
2. Fetches `contributionCalendar.weeks.contributionDays` for all years in a single query
3. Sorts all days chronologically
4. Walks forward to find the longest streak
5. Walks backward from today to find the current streak (allowing today to have 0 contributions since the day isn't over)
This runs in two GraphQL calls total, so the streak card loads in well under a second — no external service needed.
## Setup
If you want to use this yourself:
1. Fork [compscidr/github-readme-stats](https://github.com/compscidr/github-readme-stats)
2. Deploy to Vercel with your `PAT_1` (GitHub token with `repo` scope)
3. Create a public gist for the cached stats
4. Add `GH_TOKEN`, `GIST_ID`, and `USERNAME` to your repo's secrets/variables
5. Run the GitHub Action manually once to populate the gist
6. Add the card to your README
Full setup instructions are in the [repo README](https://github.com/compscidr/github-readme-stats).
## Trade-offs
Nothing's perfect:
- **Overview stats are up to 24 hours stale**: they come from the daily Action run, not live. Streaks and languages are live though.
- **First load can be slow**: if Vercel's cache has expired, the live GraphQL calls for streak + languages take a few seconds. Subsequent loads are instant.
- **Vercel free tier has a 10-second function timeout**: this is why the overview stats had to be cached in the gist rather than computed live. The combined card reads from the gist to stay under the limit.
- **Action run time varies**: GitHub's contributor stats API returns 202 "computing" responses unpredictably, so daily runs can take anywhere from 17 minutes to over an hour. The Action logs per-repo progress so you can monitor it.
## Debugging
The GitHub Action logs progress per-repo during the daily run, making it easy to spot which repos are slow or hitting API errors. There's also a debug endpoint:
```
/api/top-langs?debug=true&username=YOUR_USERNAME
```
This returns JSON with the total repo count and a per-repo language breakdown — useful for tuning your `EXCLUDE_REPO` list or figuring out why your language stats look off.
## Links
- [compscidr/github-readme-stats](https://github.com/compscidr/github-readme-stats) — this fork
- [anuraghazra/github-readme-stats](https://github.com/anuraghazra/github-readme-stats) — the original
- [jstrieb/github-stats](https://github.com/jstrieb/github-stats) — REST-based GitHub Actions approach
- [DenverCoder1/github-readme-streak-stats](https://github.com/DenverCoder1/github-readme-streak-stats) — streak stats inspiration