Blog stats
This blog has been running for quite a few years now and I got thinking about the traffic patterns on it today in an earlier post, so I thought I’d put some of the info together into a post :)
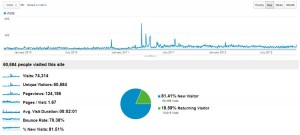
Here are the visits in the last three years (74,000 hits)
And in just the last year (30,000 hits)
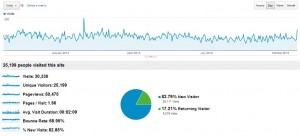
The average time on the site remained about the same when looking back one or three years and in both cases is about two minutes.
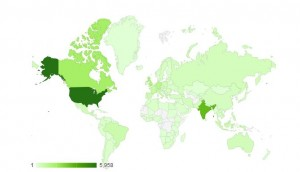
Here is a world map showing the countries where most of the traffic comes from. The top three were US, India and Canada. The darkest colour represents almost 6000 hits.
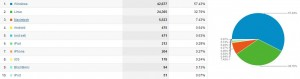
The most popular browser with visitors of my site is Firefox, followed by Chrome, IE and Safari. I was a bit surprised that Safari did more poorly than IE, but I guess it can be expected when you see the next figure with OS’s.
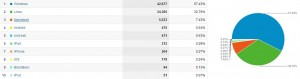
The most popular OS’s for my site: Windows, Linux, Mac. This makes me a little sad that Linux wasn’t the highest proportion, given the content of my site…but it was at least respectable.
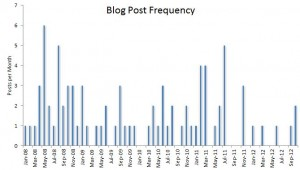
Lastly, here is the posting frequency. There have been 83 posts total according to the wordpress admin page.